![]()
The Basics of Elliott
Wave Analysis
Part II
|
|
The Basics of Elliott
Wave Analysis |
|
What Makes Prediction Possible
The Wave Principle operates in any freely traded market, whether stocks,
bonds, futures or forex. Because it reflects the process of human
mentation and mass sentiment, the same psychological patterns repeat themselves,
regardless of the specific market. With the Wave Principle, Elliott
developed a model that was based on market form, and it is the
market's formological basis that makes forecasting possible. By knowing
how these forms come together, we are able to predict market direction within
high probability. The concept of market form has been further established
by Benoit B. Mandelbrot, the father of Fractal
Geometry, and Elliott Waves have been defined as "robust fractals" by
Robert Prechter in his ongoing work with EWP. Gann's work also
corroborates the market's fractal character.
The next step in the development of the Wave Principle was the discovery of the tools needed to measure these forms, and their likely direction.
The Fibonacci Sequence - The Secret to Market Movement
In his second book Nature's Law, Elliott refined his work to
incorporate Fibonacci analysis. Since the beginning of his
research, Elliott believed that the wave pattern he discovered was not the
product of random chance, but of what he considered a "natural law" that
was manifest in different facets of life. Indeed, we take the name of our
market service from one of his observations:
"...the market has its law, just as is true of other things throughout the universe. Rhythm, or regular, measured and harmonious movement, is to be discerned. This law behind the market can be discovered only when the market is viewed in its proper light, and then is analyzed from this approach."
Through use of the Fibonacci sequence, Elliott attempted to identify the blueprint of that natural law.
Who was Fibonacci? Leonardo Fibonacci was a brilliant 13th Century mathematician from the city of Pisa, Italy. While that city is better known for its leaning tower, Fibonacci is much more significant to our modern evolution. It's thanks to him that we use the numerical system popularly called "Arabic," which replaced the cumbersome and inefficient Roman numeral system, and added much needed refinements like decimalization, absolute values and other concepts that underlie our modern mathematics. If this was Fibonacci's sole contribution, it would still have been enough for its impact on western civilization. But this was only part of his contribution.
Much of Fibonacci's work is technical, and so we'll only summarize the key elements, particularly those that Elliott incorporated into the Wave Principle.
The Golden Ratio: The Golden Ratio (also called the Golden Mean or Golden Section) is based on the proportion 1.618-to-1, and its inverse .618-to-1. Through his research, Elliott found that the ratio was manifest in the design of natural structures (everything from snail shells to galaxies) as well as in human creations. The proportions are found to be pleasing to both the eye and ear. Another famous Leonardo, Leonardo Da Vinci, realized the ratio's significance in both art and science, and used it widely in his paintings and scientific drawings. The Ancient Egyptians used it in their art and architecture, including the building the of pyramids. Their contemporaries in what became Latin America also knew the ratio and used it in constructing the ancient pyramids found in Mexico and Peru. After thousands of years, these remain some of the most impressive engineering feats in human civilization. Because the Golden Ratio has a mathematical basis, Elliott felt the Wave Principle was built upon the same basis, and that the stock market, with its statistical records, was a natural place to look for it in action.
The Fibonacci Sequence: In addition to the Golden Ratio, the Fibonacci Sequence (or Summation Series, as Elliott called it) became an integral part of the Wave Principle, and is used in both wave ratio analysis, and in analyzing relationships between waves with respect to price and time. The Sequence is derived from the following observations Fibonacci made: The sum of any two adjacent numbers forms the next higher number in the sequence; e.g. 0+1=1, 1+1=2, 1+2=3, 2+3=5, 3+5=8, 5+8=13, 8+13=21, 13+21=34, 21+34=55, 34+55= 89, 55+89=144 -- and on into infinity. In this sequence, he also observed the following relationship between the sequence numbers: The ratio of any number to the next higher number is approximately .618 to 1, and to the next lower number 1.618 to 1. Between alternate numbers in the sequence, the ratio is approximately .382, whose inverse is 2.618. These might be considered "primary" Fibonacci ratios. There are secondary and even tertiary ratios that are useful in trading, which I discuss below in more depth. Before we continue, though, I should say a few words about sentiment, which, in effect, is what produces wave patterns, and is the engine behind what we might call the "Fibonacci Effect."
Sentiment
Elliott contended there was an order in the market, and that it reflected
natural cycles in human nature. Some academicians and others dispute that there is any
"order" to the market, much less something so seemingly esoteric as
"natural human cycles." However, an experienced application of Elliott
Wave directly challenges their view.
People, like the changes of the seasons, go through their cycles. We know this based on bio-rhythm research conducted over thirty years ago, which showed human beings do, in fact, go through emotional peaks and troughs, sexual peaks and troughs, physical peaks and troughs, and intellectual peaks and troughs that recur cyclically as the human organism renews itself. This apparently happens individually and en masse. When applied to the market, the effects of "news" are more likely to be determined by the sentiment then prevailing, than the particular event itself. Indeed, the record shows that trends in progress continue to their completion despite periodic reversals, and regardless of news events (whether good or bad) that occur in between. This is perhaps less obvious when viewed day-to-day, but very obvious when viewed in historical context. We've frequently seen cases where stocks have sold-off despite a report of good earnings, as well as the opposite case, where stocks experienced ridiculously high valuations when the fundamentals didn't justify them. These contradictory actions show the emotionally charged nature of the market, and how important, therefore, an understanding of sentiment is to trading. Wave analysis, combined with Fibonacci analysis, provide a mathematical roadmap to marking these sentiment swings.
Trading The Market With Elliott & Fibonacci
Below are examples of how these concepts are applied in practical trading,
including some examples from my personal trading.
Retracement Ratios: Waves tend to retrace either exactly, or in relationship to, a Fibonacci ratio. As we discussed earlier, "primary" retracement ratios include , .382, .50, .618, 1.0, 1.618, and 2.618. These are also commonly expressed in percentage terms.
Secondary and Tertiary Retracement Ratios: Some of these include...
.786, the square root of .618. Retracements will commonly fall in the .77-.786 range.
2.236, is the square root of 5, the most important number in the Wave Principle and key to the composition of the Golden Ratio (2.236 + 1)/2= 1.618; (2.236 -1)/2= .618.
Similarly, retracements of .236 (.6183) are also prevalent, especially in corrective waves.
Our work at Market Harmonics has also found .89 (the square root of .786) to frequently occur in deep retracements.
The value of these ratios is that taken with correct wave labeling, the ability to forecast price targets can be amazingly accurate.
Impulse Wave Relationships: We noted previously that in impulse waves, the non-extended waves (usually 1 & 5) will tend towards equivalence in length and time of formation. Since wave 3 is generally the longest wave, it will often (though not always) be 2.618 the length of waves 1 and 5. Where the waves are not of the same length, a Fibonacci relationship usually exists between them. Similarly, a Fibonacci relationship generally exists between waves 2 and 4 in the cases where one of the waves exceeds the length of the other. Finally, wave 4 often divides the entire impulse sequence by the Golden Ratio.
Corrective Wave Relationships: In 3-wave corrections, we look particularly for Fibonacci relationships that exist between waves A and B, and waves A and C. In A/B relationships, B will often be shorter, especially in a zigzag, with Fibonacci retracements of .382, .50 and .618 the most common. In a flat, B can be equivalent or even a bit longer than A. In A/C relationships, C is generally equal to or greater than A in length, and in cases where it is longer (or shorter) will generally be related to A by a Fibonacci ratio, most commonly .618. In an irregular (or expanded) flat correction, wave C can exceed A by as much as 1.618 or 2.618. In triangles (and as another example of the alternation guideline) at least one wave is related to its alternate by .618, or occasionally .786 (i.e.., wave A with C, B with D, or C with E).
Time Considerations
Elliott Wave analysis will usually forecast price targets either exactly or
within points of a target. Where it can be more challenging is
with time estimates. Elliotticians generally believe that time is secondary to wave
form. But there are clues in the wave pattern and Fibonacci sequence
that will help narrow the time frame for a significant trend change with reasonable
accuracy.
One way is the actual waves themselves. If you are tracking, say, the conclusion of a wave 5, knowing that it should be equivalent to wave 1, or related in length by a Fibonacci ratio, you can apply the same forecast to time as well as price. For example, let's say wave 1 took 10 days to form. You might project wave 5 to take 10 days to also form. If wave 5 exceeds wave 1 in its formation, look for potential tops in roughly 13, 16, to 18 days. If on the other hand wave 5 appears to be losing steam on declining volume and may end up being shorter than wave 1, look for a possible reversal between 5-8 days from the start of its formation. I use days in this example, but the same can be true of months or years.
Occasionally, numbers in the Fibonacci sequence that coincide with dates for previous key market reversals can help in forecasting future ones. I used this method in helping to track turns in what then appeared to me the early phases of a bull market in oil and natural gas in March 2000 (right as techs were starting their nosedive). I discuss this, along with the application of the Wave Principle, in some examples from my personal trading.
First, I looked for past Fibonacci relationships between previous dates of significance (anywhere from 34, 55, 89, 144 or 233 days) and looked for any repetitive patterns based on these numbers. I also looked for where two or more of these dates converged over a similar time frame. This method assisted me in clarifying my wave count, and told me when to go long and when to go short the XNG and XOI indices, which I did successfully over the next several months. The method isn't full proof by any means, though it seems the greater the number of relatable dates, the better its chance for timing potential changes.
I also incorporated this method in trading option contracts on the OEX (the S&P 100 index). I noted in my analysis a convergence of Fibonacci dates in the OEX around November 25, 2000 right in the middle of a two day rally following the Thanksgiving holiday. The foreknowledge allowed me to go short the index with option put contracts, as I expected a market decline to occur into early December. The OEX did indeed peak on November 27 (the first available trading day after the holiday) and declined until November 30, yielding me a nice profit on my options.
I had also projected two more potential time opportunities for the OEX (one to go long, one to go short) first on December 3-4, and then on or by Dec. 13. Below, I include my work charts from this period. I hope you'll please excuse the coffee stains and chicken-scratch, as these were actual working charts.
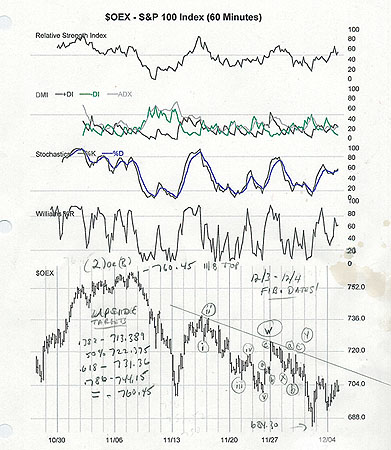
I labeled this chart on December 5 right at the start of what turned out to be a nice rally. I wasn't sure at the time, though, how much legs it would have, as I was trying to resolve the wave count from the 684.30 bottom on Nov. 30. I drew a trend line connecting two recent highs as a test, as I studied the wave pattern from the beginning of November, and noted that the overall pattern looked "corrective" and dominated by "threes". At the same time, there was a clear impulse wave up that had formed from the 684.30 bottom, suggesting a still incomplete upward correction that would very likely test and violate the trendline. And, it was consistent with the time estimate for a short-term rally. The figures beneath where I wrote "Upside Targets" shows my calculations for upward price targets and resistance areas using Fibonacci ratios. At this point, the index had yet to achieve even the first level .382 retracement. Another possible top was just above the 736 area, where there was a Minute Wave ii that I labeled. You'll also notice a couple of other labelings I made. The "(2) or (B)" note refers to a top on November 8 in a much larger and unfinished wave correction in the OEX. Some of my other notations indicate my tracking of this still incomplete declining wave.
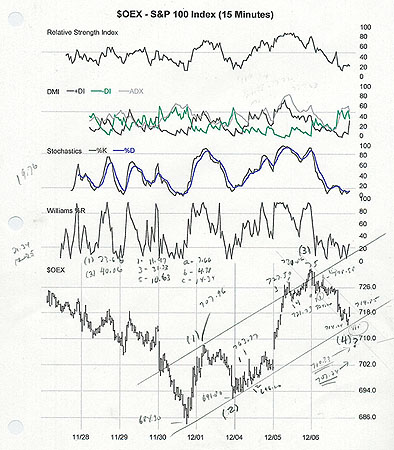
Here I show a 15 minute chart of the results two days later. The 15 minute chart allowed me to get a better snapshot of the near term action. As you can see, the rally did, in fact, have legs, and confirmed my earlier forecast in November. When the OEX broke through my original trend line, I was in the market with some option call contracts to profit from the upside. You'll also see here that much more of the pattern is revealed, and I adjusted my original labeling to account for the wave action. I saw what appeared to be a wave 3 breakout, and the subdivisions of the wave appeared just as impulsive. If you remember from the first chart, the .618 retracement I calculated called for resistance at 731.36. Although it's not that clear on the chart, the index peaked at 732.79 and then reversed. I was happily out of the market at that point, having benefited from a 20 point index rise. Finally, I also calculated the potential length of what I considered to be a wave 4 pull back in progress. Using the Fibonacci ratios, I found support for wave 4 at 710 and then 707. If the index had broken below 707.46, it would have invalidated my count, since the 4th wave would have overlapped the 1st, violating one of Elliott's rules. It actually found support right in the middle, at 708, which kept the count valid. This also made wave 4 about even with the length of wave 2, and not surprisingly, just as wave 2 took 1 day to complete (Dec. 2 & 3 fell on a weekend) so did wave 4.
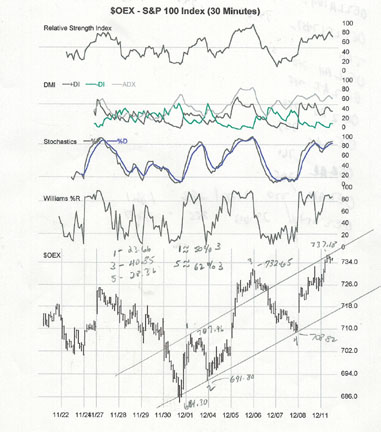
Here we see the last stage of this rally on a 30 minute chart. You'll note that wave 5 topped at 737.18, surpassing the wave 3 high, and falling a little short of the .786 retracement. It was, however, right in the range of the previous Minute Wave ii just above 736, which I had also considered a potential top. That, and the overbought condition of the technical indicators above the chart, told me the rally was running out of steam. Also, all the impulse waves (1, 3, & 5) were in relationship to each other by either the 50% or .618 retracement ratios, another head's up. Finally, you'll see the trend channel that I drew. Elliott stated that a parallel trend channel drawn from the peak of wave 1 through the base of a vertical wave 3 will often reveal the likely top for wave 5. That was certainly the case in this instance. In all, it was enough to tell me the rally had ended -- right on December 12. My next move? Position for option put buying to profit from the imminent decline.
Other Practical Considerations
Frost and Prechter noted that the Wave Principle works best with index trading,
and to a lesser extent, stocks. Their view was that since
the Wave Principle measures mass psychology in the market, individual stocks (and
some commodities) didn't always provide reliable wave patterns for trading.
After some years of putting Elliott to practical use in trading, I think their
view is still generally true, though the market landscape has changed in some
significant respects since their book was written. For one, there are
individual stocks today that trade in higher daily volumes than the entire Dow Jones
Industrial Average in the 1970's. Futures market volume has also increased
dramatically, with the CME reporting the highest contract volumes in its entire
history being reached in 2001. Consequently, I've been able to trade
stocks pretty successfully using Elliott, though I usually won't bother with
those that don't trade at least a million shares daily, or offer little
volatility, since this helps produce good, readable waves. In my
experience, that, in combination with other technical indicators, and a look at
the fundamentals work well
with using Elliott to trade high volume stocks.
I know that some Elliotticians and technicians turn their noses up at fundamentals. In the case of individual stocks, a look at fundamentals is justified for a few different reasons. First, it's an insight not only into the thinking, but also the sentiments of fundamental analysts towards a stock. For instance, valuations are key in gauging the relative value of a stock, and a stock with a low earnings yield and high P/E is doomed to correct, no matter what the touts tell you. Secondly, it's consistent with Frost and Prechter's view that the circumstances of a particular stock are just as likely to be affected by individual factors as technical factors. Third, such information is so freely available nowadays, it's silly not to look at fundamental analyst estimates, even if your ultimate decision is contrarian. Martin Pring, one of my favorite technicians (and one of the best out there) recommends that a wise trader take a "weight of evidence approach" to trading. After all these years, it remains one of the best pieces of advice I've ever heard.
Conclusions
Perhaps for those seeing this for the first time, the Wave Principle might
appear somewhat complicated and difficult to follow. I've
only provided the highlights of Elliott Wave analysis in these pages. When I first came to trading and looked at numerous
trading systems, none offered the consistently accurate record of forecasting
and analysis as the Wave Principle. Robert Prechter, the leading exponent
of Elliott Wave analysis today, proved it's effectiveness after winning a series
of trading championships in the 1980's, where he was up against some of the
market's foremost traders, earning an impressive 400% on his trades.
Some of the most stunningly accurate major market forecasts have been made by Elliotticians, including Elliott's own remarkable forecast of the end of a bear market decline in the Dow from 1933-1935, which he forecast to the exact day in a telegram to his publisher. Elliott also accurately forecast the bull market during World War II and its decline well ahead of the actual events. When one considers that in Elliott's day he was making charts and calculations by hand, without benefit of all the computerized toys we take for granted today, and that he was 67 years old when he embarked on his career as a forecaster, his discoveries and accomplishments are all the more impressive. A. Hamilton Bolton, a leading Elliottician during the 1950'-60's and founder of the Bank Credit Analyst advisory service (BCA Research today) forecast in 1960 the Dow would reach 1,000 in 1966 (it had been trading in the 500-600 range for most of that period). On February 9, 1966, the Dow reached an all time high of 995, having peaked at just over 1,000 intraday. In their 1978 book "Elliott Wave Principle, " written during the depths of the seemingly endless 1970's bear market, Robert Prechter and A. J. Frost predicted a vibrant bull market would begin in 1982. The forecast also called for the bull market to crash in 1987. As we know, the end of 1982 saw the rise, seemingly from out of nowhere, of a powerful 5-year bull market that peaked with the market crash of 1987. With an understanding of the principles of Elliott Wave analysis, it becomes clear why such bold forecasts can be made.
|
|
If you're ready for a more serious study of EWP, order the book that started the Elliott Wave revolution - Prechter and Frost’s bestseller, Elliott Wave Principle - Key to Market Behavior. The latest edition of the investment classic includes notes from the 20th anniversary edition, a special foreword and refined text. |
|
|