|
|
Sentiment Charts
|
Option Buyers Sentiment Gauge (OBSG)
Traditionally, daily Put/Call Ratio data from the CBOE focuses on the total volume of
Puts
and Calls purchased for the equities market as a whole. In November 2000, I began tracking
Put/Call volume data on a few other sectors, as I was curious to see what correlation there
might be in options buying among select groups as an expression of general market
sentiment. I was particularly interested in groups that showed marked
contrasts or significant distinctions in their option buying patterns (i.e.,
which buyers reflected more bullishness, and which reflected more
bearishness). My theory was that a "tug-of-war" between groups
with different option buying tendencies might produce a more revealing snapshot of
sentiment, than just plotting daily P/C Ratio readings alone.
While I played around and combined different groups in developing what ultimately became the Option Buyers Sentiment Gauge (OBSG), I ultimately chose to focus on the daily option buying patterns of two key cohorts in the options market: Index options buyers and Equity options buyers. Both groups are very distinct in their options buying positions, and offer exactly the kind of "tug-of-war" trends in psychology that I thought might give more insight into the P/C Ratio itself.
Index option buyers (at least for the period I've studied them) generally maintain short option positions, with P/C Ratios consistently over 1.0, meaning, of course, their Put buying is greater than their Call buying. It's also far more common for institutions to hedge their positions with Index Puts, than the average trader. The pattern displayed by Equity option buyers (who are more typically the average trader) is, on the other hand, far more bullish. For the same period of study, Call buying outweighed Put buying, with very few breaks above 1.0. This dynamic has yielded some interesting results in trying to pinpoint sentiment extremes, and therefore, significant changes of trend.
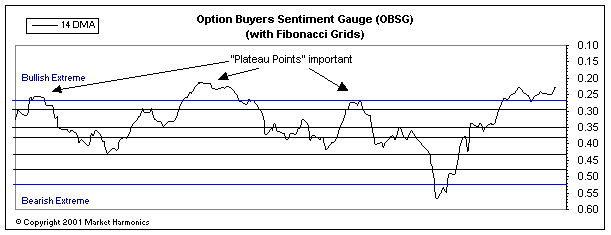
The Option Buyers Sentiment Gauge (OBSG) which I've developed applies the principles of momentum and relative strength to the daily average P/C Ratio for Equity and Index option volume. It is plotted with the Wilshire 5000 Total Market Index to relate price and sentiment trends.

Note that we apply Fibonacci grids to mark areas of support and resistance. We also plot the values inversely to parallel overbought/oversold conditions in the market. I've added the "Extreme" lines to help identify these areas. Here are a few other things you should know before using the indicator:
1) The OBSG measures sentiment trend, not price trend. It has often given what might be considered "sell" signals a few days ahead (and as much as a week ahead) of price changes, since the OBSG is primarily a short-term indicator. For example, overbought situations are noticeable by what I call "plateau points," where bullish sentiment seems not to rise much higher. These are clues of potentially large reversals. The plateaus do not, apparently, tend to occur as much at bottoms, perhaps because of the volatility associated with selling. However, even in these cases, it has often signaled strong upswings ahead of price. Still, it should always be used with other indicators that note overbought/oversold conditions.
2) The Bullish/Bearish Extreme lines are important in helping to gauge the relative maturity, and probable reversal, of the prevalent sentiment trend.
3) Divergences are also very important. If price is rising, but OBSG is dropping, it's a big head's up that selling is likely to follow, and it could get especially heavy if there is a sharp break of Fibonacci support.
For those who are curious, I tried the same approach with just the daily P/C Ratio data alone, but without the same dynamic results. This makes sense, since the relative strength aspects the OBSG are an important part of the gauge.