Market Harmonics

Commitments of Traders (COT) Reports
|
|
Commitments of Traders (COT) Reports |
COT Background
The Commodity Futures Trading Commission (CFTC) publishes on a weekly basis data
that reflects various trading positions held by commodity and futures traders
known as "Commitments of Traders" Reports (COT). The combination
of Elliott Wave analysis and COT data, provide a powerful set of tools for
studying sentiment in the futures market and trading near-to-intermediate term
price patterns. In interpreting the COT chart data we provide, it is
important to first understand why the futures market exists in the first place,
who the key players are, and how their trading activity can help us better
inform our own trades.
Who Are the "Commercials?"
The history of the futures market makes fascinating reading, but what's most
important is understanding its central premise, which is the transference of
risk. Farmers, mining companies, oil producers -- all have risk
exposure to changes in the cash, or "spot" market that they seek to
hedge by transferring that risk to others. "Commercials" are
defined by the CFTC as those who specifically use futures or options for the
purposes of hedging and risk management.
Non-Commercials
Non-Commercials, also called Large Speculators or Large Traders, are primarily
institutions and major investors who are responsible for a lot of the liquidity
in the futures market. They are primarily looking for contract
appreciation, but may also hedge on some futures. For instance, in US
Dollar Index futures, they may apply what's called a "long-long hedge"
by buying USDX futures to offset losses on their spot positions in, say, the
Euro against the USD. That notwithstanding, the bottom line is that they
are mainly speculators in the market, making them distinct from
Commercials. Large Speculators are a key group in that they are the
primary movers of futures prices, and while the activity of the Commercials is
significant, we tend to give more weight to Large Speculator trading trends as far as market direction.
Using Our COT Charts
Our COT charts focus on Large Speculator net long/short open interest data that allows the user to follow
the sentiment trends, and in particular to note extremes in bullish or bear
sentiment, as such extremes tend to promote trend reversals. These
are not designed for timing per sť, since the time lag in the release of COT
data makes it somewhat impractical for precision timing (for that, we use
Elliott Wave). Instead, the charts should be viewed with respect to
persistence or potential reversal of trend.
For example, if the data is displaying extremes of optimism, then there is a high probability of an impending reversal.
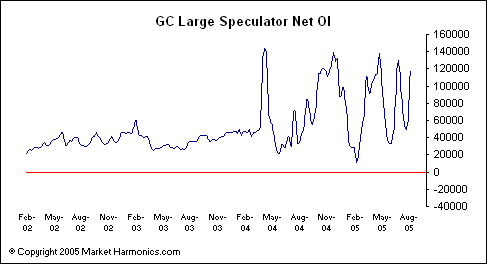
Large Speculator Net OI: This chart plots the simple difference between Large Specs who are long or short a given future to arrive at their net position. If they are more net long than net short, the market will tend to be rising, and vice versa. Crosses above or below the red zero line reflect the net position, as seen below.

In the above sample, Large Specs are net long (above zero) gold futures. A move in the net position that retraces a level associated with a previous market reversal is always something to watch out for. Something else to observe is whether new trends exceed or fall short of previous levels.
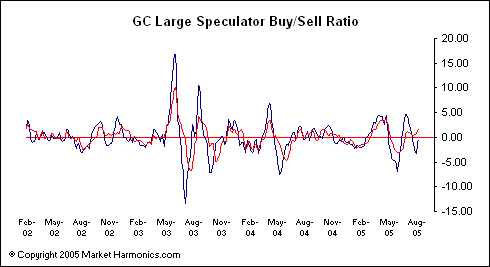
Large Speculator Buy/Sell Ratio: This is a proprietary indicator that adapts formulas that we use in measuring advancing and declining stock market volume to measuring trends in Large Spec long/short open interest. Built in to the formula is a relative strength measure, so that it is different from the Net OI chart in that it takes underlying trend strength into account for the net position. The chart is constructed with a 5-week Moving Average (red) and 8-week Moving Average (blue) which are the signal lines we use to track trend strength.

In interpreting the data, two things to look out for are separation in the moving averages, and crosses above or below the zero line. In an uptrend, it tends to be bullish when the faster red signal diverges up and away from the slower blue signal. The strongest buy trends find both signals above zero and continuing to rise above it. In a rising market, a divergence down in the indicator against price tends to have bearish implications, and may be a warning that buying is reaching a climax and starting to give way to sell interest. Also, the Buy/Sell ratio tends to lead the Large Spec Net chart in announcing trend changes, so look for any divergences between them, as it may signal a change of trend for the latter.
USE YOUR BROWSER'S BACK BUTTON TO RETURN