
![]()
|
|
|
Citigroup
Inc. (C)
(1/9/08)
Before you say to yourself he's finally lost it, let me tell you why I think Citigroup is due for a bounce.
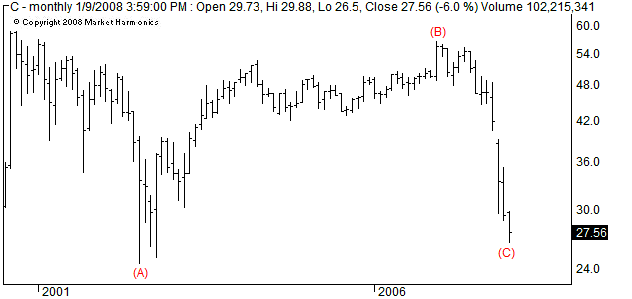
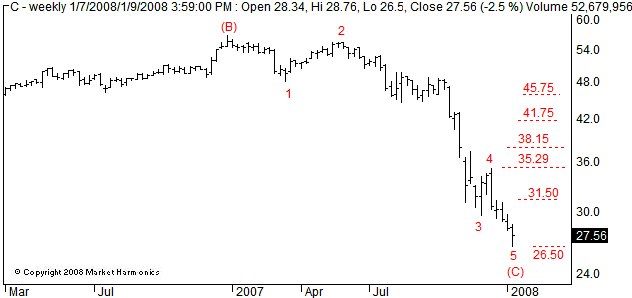
First, as the monthly chart shows, Citigroup's correction from September 2000, for all of its sharpness, traced out a fairly textbook flat correction at Intermediate degree. Also, a full 5-wave decline pattern is complete from the start of the stock's Wave (C) correction on December 28, 2006. Assuming the stock hit a bottom on January 9, 377 Fibonacci days would have passed, not a guarantee of anything, but an event worthy of note when taken in consideration with other factors. Currently, Waves (A) and (C) would be related by 88%, so there is equivalence of length, which is characteristic of flat corrections. Also, Wave (C) has already erased virtually all of the Wave (B) gains from July 2002, the last bottom of note, and corrected .618 of its last major bull run from 1998-2000. Consequently, there are a series of key intermediate and primary degree retracements that have developed. Finally, the stock is deeply oversold, and the current 21-day Put/Call ratio is well over 300. Therefore, a technical bounce should not be unexpected. While the end result may still be no more than sucker's rally, it's still one that should be tradable, as long as one observes the Fibonacci resistance levels. There is lower support at 24, and we can't rule out possible test, but if a bottom is in, then one of the first key retracements and violations needed is a break through 31.50, which offers an entry. 28 can be used as a stop. If successful, then it should lead to the next key retracement at the level of the previous Wave 4, at 35.29. I've drawn other potential Fibonacci retracements, with 38.15 the .382 retracement, the attainment of which will be key to what comes next.
Incidentally, and while I'm still long-term bearish financials, the space is due for at least some near-term relief. The decline in GS, for instance, has been fully corrective, and so I suspect it too will rally. MER is also coming off a big 5-wave decline like Citigroup, so I wouldn't be surprised to see it rally either.
For an option play, you can consider the June 2008 $27.50 Call (symbol CFS), currently selling for $3.15, with the Delta at 0.59.
©Copyright 2008 Tony Carrion. All content presented is the exclusive property of Market Harmonics. com, which is owned & operated by T. Carrion & Co., LLC, and may not be duplicated or distributed without the express written consent of the author.