

|
|
|
ICICI
Bank Ltd. (IBN)
(3/19/07)
IBN is an India-based bank listed on the NYSE that has had a nice run, but whose current wave pattern suggests at least another downdraft is likely, and that we think is offering an opportunity for a Put or a short play.
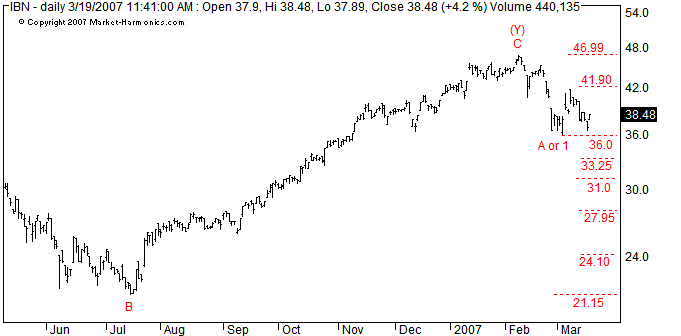
The stock traced out a 5-wave decline between Feb. 8 and March 5, falling from 46.99 to 36. This came following a 7-wave advance from 2002, best counted as a double three, and for which there is evidence of completion. The impulse pattern to 36 is counted as either Wave A or 1 down. The latter implies a deeper correction if in fact its advance from 2002 topped, and the Primary trend has turned bearish. It's too soon to be sure on that, though minimally the wave pattern suggests a full ABC decline should still be lie ahead. Under that view, Wave A would have already bottomed at 36, and Wave B may possibly have topped at 41.90. The best confirmation that Wave C has commenced would be a break of the 36 low. I've noted the various downside possibilities, and if the more bearish count were in effect, it could result in a full retracement of the advance from July 2006. If instead the ABC pattern is in effect, generally Waves A and C in a zigzag tend towards equivalence of length, which could see the stock fall to the 30.90-31.0 area. This also crosses with the .618 retracement of the July-February advance, so this level should be considered support, even if temporary. If using 36 as an entry, 39 is a suggested stoploss.
For the option play, the September 2007 $40 Put (symbol IBNUH) is currently selling for $4.70 with the Delta at 0.48. The low volatility climate has impacted Put pricing with respect to Delta, so if you play a different option I'd suggest staying as close to the money as you can.
©Copyright 2007 Tony Carrion. All content presented is the exclusive property of Market Harmonics. com, which is owned & operated by T. Carrion & Co., LLC, and may not be duplicated or distributed without the express written consent of the author.