
|
|
|
SiRF
Technology Holdings Inc. (SIRF)
(5/7/07)
We're looking at a near-term technical opportunity in SiRF Technology, which ideally can surf its way back to its February high of 34. This is a pure Elliott Wave play, and both the depth of Put interest and short interest indicate any unwinding should prove beneficial. The stock has twice bounced off the 23 level, which is long-term Fibonacci support, and combination of these factors suggest some reasonable upside ahead.
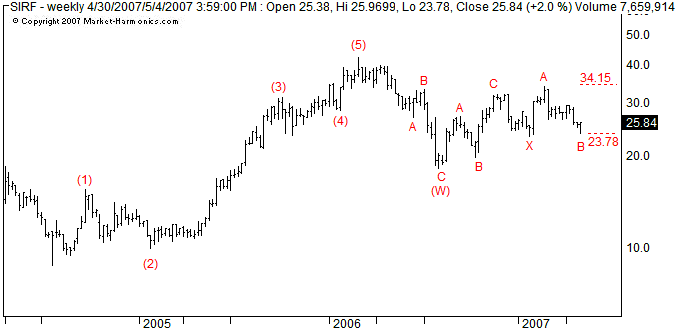
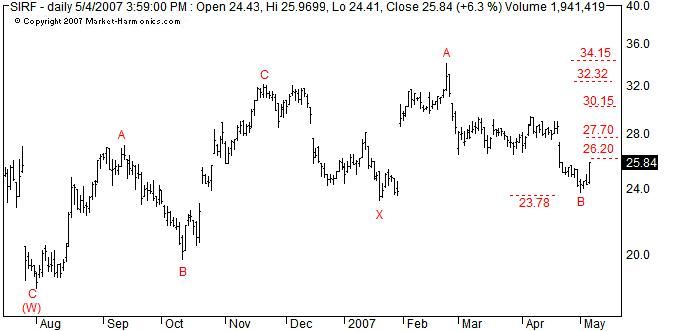
As the weekly chart suggests, we're playing an upwardly corrective pattern - a double zigzag - and ideally we're catching the final Wave C pretty much at the beginning, as the daily chart shows. Only six of the seven waves that should form this pattern have developed, so we're fairly confident the seventh is about to launch. If correct, it should retrace and likely exceed the top of the previous Wave A at 34.15, something also suggested by the overall pattern of higher highs and higher lows going back to the start of the double zigzag in August 2006. If you don't mind a slightly riskier entry, I'd suggest a break through 26.20. Some resistance at the 27.70 area should be expected, since this represents the 38.2% retracement of the decline from February, but it should prove only temporary in the formation of Wave C. A more conservative entry might await a break through that level, but of course you also give up some positioning. Your choice. The 23 area is a good support level, so a stoploss can be set just below to limit risk. Intervening areas of resistance are noted on the daily chart.
As an option play, the September 2007 $27.50 Call (symbol QIRIY) is currently selling for $2.55 with the Delta at 0.51.
©Copyright 2007 Tony Carrion. All content presented is the exclusive property of Market Harmonics. com, which is owned & operated by T. Carrion & Co., LLC, and may not be duplicated or distributed without the express written consent of the author.