A Market Harmonics Favorite... Why We Love VOptions
Simply put, the Visual Options Analyzer (VOptions) is great piece of software, whether you're a novice options trader, or an experienced options trader wanting to explore advanced strategies before risking money. For us, the "risking money" part is important, and the software's built-in tools let you run both simple and complex scenarios to test your strategies before committing.

One of the things we really like about the program is its combination of powerful tools with a simple and intuitive interface. Unlike stocks, options offer traders leverage that can work either for or against them, and being right about market direction isn't necessarily a guarantee of profitable trades. As we note in our free Options Guide, one of the mistakes novice options traders make is to load up on deep out-of-the-money options, and then get disappointed when their contracts expire worthless - even though the underlying stock was moving in the direction they thought it would. Volatility and the so-called "Greeks" like Delta have a lot to do with why this happens. But what if you could actually see in real money terms the consequences of your decision before your risk real money? Or maybe you're already an old hand at trading long options and now you're ready try some more complex strategies like spreads and synthetics, but want to test out your strategies before putting real cash on the line. VOptions lets you do this and more with some excellent built-in tools.
Using Built-In Strategies to Simplify Trading
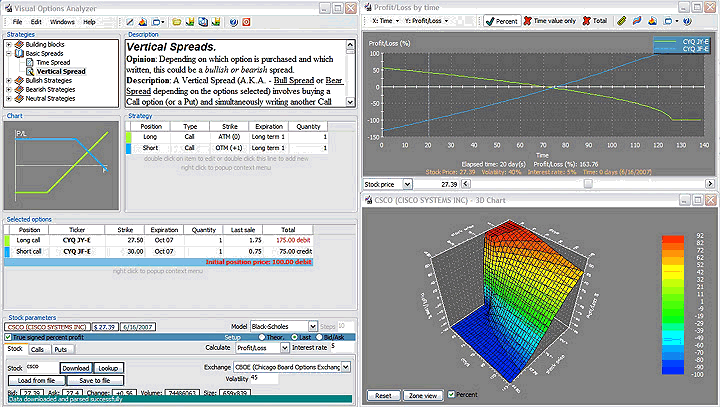
VOptions greatly simplifies the process of analyzing options trades by having 32 of the most effective and popular options strategies built-in to the software.
Each strategy comes complete with a graphical representation, an example, and a detailed description explaining the basics of the strategy,
the situations in which it is typically used - and very important - its risk/reward characteristics.
Using Advanced Charts for Visual Analysis
VOptions provides 2 and 3-dimensional charts for analyzing option strategies,
from the simplest like buying long Puts or Calls, to more complex spreads,
straddles, synthetic option trades and hedging strategies. The power of these charts is that they
actually let you see ahead of time how much money you stand to make or
lose with your strategy based on changes in market conditions for the stock or
index you're thinking of trading.
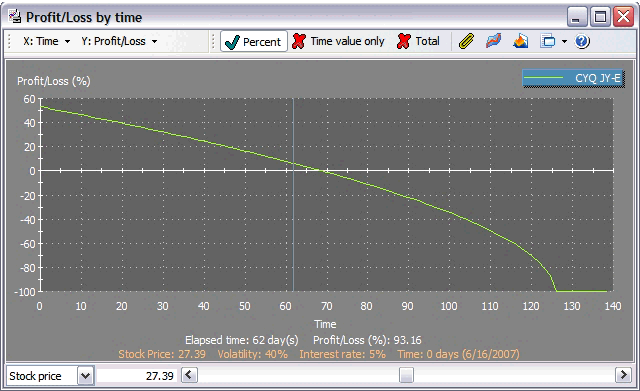
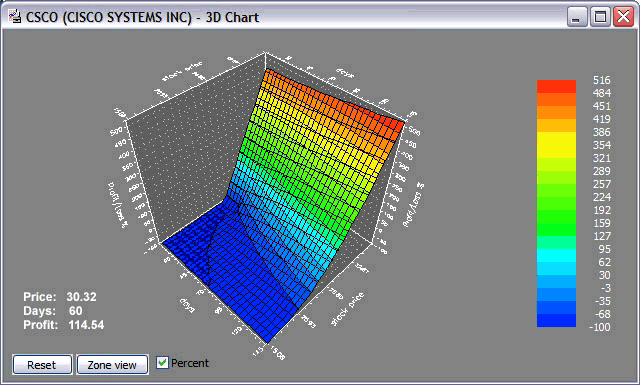
Let's say your research tells you a particular stock is headed up over the next few weeks or months. Just download the available options for that stock right into the program, select the Call and strike price (or try different strike prices if you're not sure) and VOptions automatically generates a 2D and 3D graphical representation of your strategy, as shown below.

The 2D chart is highly customizable. For example, the X-axis can be changed to show time, volatility, or interest rate instead of stock price, and the Y-axis can display the "Greeks" (which it also calculates for you - another great feature) in addition to the total profit/loss for each interval. The real strength of the 2D chart, however, lies in dynamic analysis. At the bottom of the graph is the Slider, which lets you see how changes in underlying parameters such as volatility, stock price, time, and interest rate effect the profit/loss of your trade. The Slider feature allows you to easily perform a "what-if" analysis of your trades. You can also compare strategies. Graphs of two or more strategies can be superimposed, allowing for quick comparison.
As option traders know, time value is an integral part of an option's price, and the closer the clock ticks to expiration, the more time decay erodes the option's price value. This is where the 3D chart (shown below) becomes very useful, and allows you to add an additional parameter to your visual analysis. For example, the chart below is for the same strategy, but displays time in addition to profit/loss and stock price. This lets you also see the effect of both time and stock price together on the profit/loss characteristics of this strategy by just mousing over the chart.

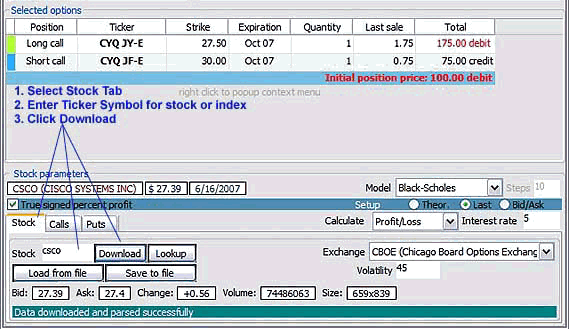
It you trade a lot of options, the program makes it easy to manage your options portfolio. You can keep track of all your positions using a single, intuitive interface. And, it eliminates the need for making multiple trips on the web to get your data. VOptions downloads free options data from the CBOE (Chicago Board Options Exchange) for virtually all options listed on the CBOE, AMEX (American Stock Exchange), PHLX (Philadelphia Stock Exchange), PCX or PSE (Pacific Stock Exchange), and ISE (International Securities Exchange). Simply enter a stock's ticker symbol and VOptions will download the current stock price (including volume and Bid & Ask price) and the "options chain" for that stock - a list of all options for sale, including expiration, strike price, and current price for each option. After you download, select either the Calls or Puts tab to add the contracts you want for your strategy.

You can try a fully loaded 10-day trial version of VOptions for free by clicking here. After clicking the link, select Save when prompted to download the installation file to your computer (save it in place where you can find it easily, like your Desktop). Next, double-click the file after it downloads to install the trial version (you'll need to be online for the installation). Once installed, open the program and download some options data to get started, per the instructions above. And then have some fun, as you explore VOptions and play with different strategies.
When you're ready to purchase VOptions, just open the Help menu within the program and click Buy to launch your web browser and have your order processed securely by RegNow, the payment processing agent for VOptions. Customer information is collected only for the purposes of processing orders and to send you your registration information. The cost of VOptions is $69.95. Try it now risk free. Click to get started!