|
|
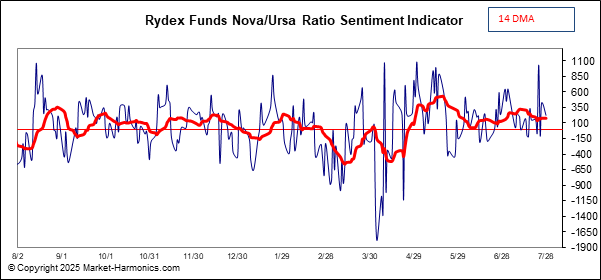
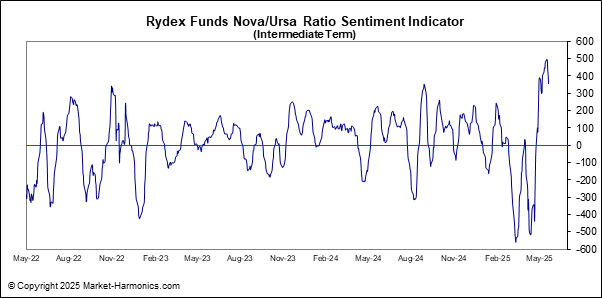
Rydex Funds Nova/Ursa Sentiment Ratio |
Description
Among measures used to check extremes in bullish v.s. bearish investor
sentiment is the performance ratio between the Nova Fund and Ursa Fund, which
are mutual funds of the Rydex company. Both funds are tied to the daily
performance of the S&P 500 (SPX). The Nova Fund, which is considered
bullish, gains in value as the SPX gains; conversely the Ursa Fund gains in
value as the SPX declines, and so is considered bearish.
Generally, indicators built on this performance ratio provide daily readings to determine levels and extremes of optimism or pessimism, and are presented in different fashions. We adjust the raw data and present it unsmoothed in Rate-of-Change form, since we find it to be effective for timing. For example, we observe that the unsmoothed data (dark blue), particularly at extremes, often yields reversal signals as much as 3-5 days ahead. So, if you can put up with the whipsaw, the results are worth it. I add a simple 14 day moving average, which helps to highlight the larger trend.
In interpreting the chart, a rising trendline suggests more money is flowing into the Nova Fund (bullish) while a declining trendline means the Ursa Fund is gaining the against Nova Fund (bearish). As with all ROC charts, distance from the zero line indicates maturity of trend.
The shorter-term indicator has also generally given reliable SPX sell signals when the red signal line crosses above and then below the upper pale blue line.
GET COMPLETE INTRADAY FORECASTS - ALL MARKETS (Elliott Wave International)
Rydex Nova/Ursa Sentiment Indicator (S&P 500 Sentiment)
Option Buyer's Sentiment Gauge (OBSG)
Put/Call Ratio v.s. Volatility
Return to Chart Menu Page