|
|
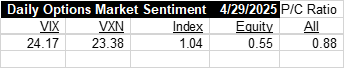
Put/Call Ratio v.s. Volatility Indices |
Read Learn the Essentials of the Elliott Wave Principle in 30 Minutes now.
See below for description
Learn About the Elliott Wave Principle
Description
Much of the data used in tracking market sentiment is derived from the options
market. On the one side is Put/Call data, which of course, is used to
arrive at the daily Put/Call Ratio. More misunderstood is the volatility
data that is used for arriving at values for the S&P 100-based VIX, and the
Nasdaq 100-based VXN. Volatility in this context refers to Implied Volatility (IV),
which is a factor in the pricing of options, particularly Put Options, which are used for portfolio protection, and as a way to profit from downturns in the market. The greater the amount of fear of financial loss, the more the “fear factor” is priced into the cost of Puts, and consequently, IV tends to go up. VIX readings of 50 or higher are associated with near-to-intermediate term market bottoms, and VXN readings of 70 or higher with the same.
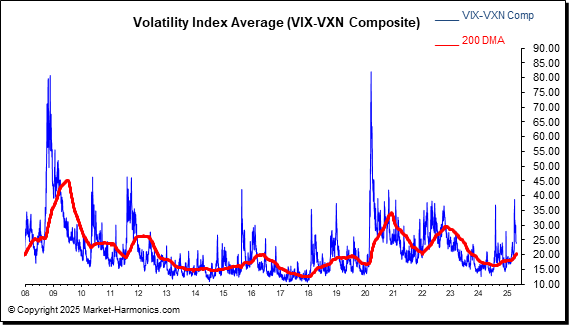
One of the things that we've observed in our research, and which differentiates these data sets, is how rather significantly volatility data tends to lag Put/Call data. The most obvious reason is that a rise in the volume of Put purchases on a day the market is dropping tends to be a visceral reaction to real-time market conditions. In other words, there's a "herding psychology" involved that is more reactive than reasoned. On the other hand, options pricing is a thought out process, and an increase in IV is more trend-driven than event-driven. Market makers at the options exchanges price in volatility based on that of the underlying market. Therefore, if the market is basically bouncing back and forth within a certain price range, implied volatilities will also move within that same range. That data ends up being reflected in the daily VIX and VXN.
When a long-term period of selling sets in, such as we saw between March and October 2002, volatility indices start to gradually reflect the "fear factor" that then gets priced in to the purchase of Puts. When viewed in this context, we can see why bifurcations between P/C Ratios and the volatility data tend to occur.
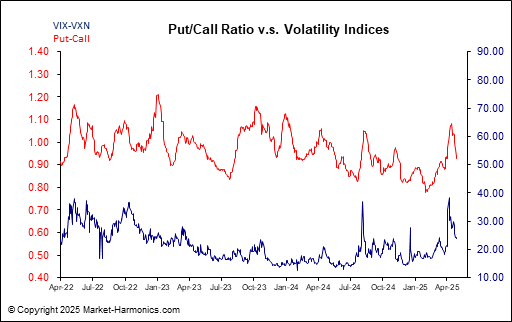
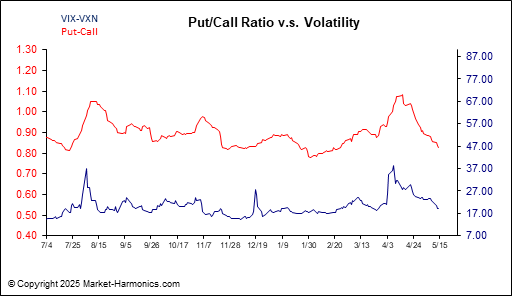
Our Put/Call - VI chart plots the two sentiment data together to note when their trends diverge and converge. The left scale (in red) tracks the P/C Ratio, and the right scale (in blue) tracks the volatility data (based on the composite data we use to create our VIX-VXN Composite index). We set January 2001 as our base year, which is when the CBOE started publishing intraday data for the VXN.
One of the things you'll note immediately when viewing the chart is that the P/C data tends to reach tops and bottoms before the volatility data. Secondly, the volatility data often tends to overshoot the P/C data at peaks and troughs. One of the reasons for this is that trend changes aren't generally seen for what they are until well into the process. For instance, after a prolonged period of selling, people approach the market more cautiously, and that bearishness takes longer to work itself off in Put pricing. Of course, the reverse is also true, and it's one of the reasons why many contrarians believe that the VIX and VXN are a good measure of complacency in the markets.
The bottom line is that the P/C Ratio tends to be more of a "real-time" indicator, but doesn't provide enough of a benchmark for persistence of trend. At the same time, the VIX and VXN are too slow for timing purposes. When studying this chart, therefore, we want to look at divergences between the data sets, which are more apt to occur during periods of complacency, and at convergences, and in particular in-synch movement, to confirm the persistence of trend, and as an aid in marking sentiment extremes. These extremes, of course, are always followed by a reversal of the trend.
Rydex Nova/Ursa Sentiment Indicator (S&P 500 Sentiment)
Option Buyer's Sentiment Gauge (OBSG)
Put/Call Ratio v.s. Volatility
Return to Chart Menu Page